| You Should Read the Tutorial First These pages will make more sense to you if you read the job submission tutorial first. It tells you how to:
You only need to read the sections that are relevant to you – don't bother with the parallel job submission stuff if you're not going to run parallel jobs. |
Performing Calculations on the Cluster Nodes
Running Matlab on the cluster nodes is very similar to running any other serial job. Let's try to run this sample Matlab program which we'll put in a file matrixmultiply.m:
% Generate two 100x100 matrices with random contents:
A=rand(100);
B=rand(100);

% Multiply the two matrices:
AB=A*B;

% Calculate the sum of the contents:
sumAB=sum(AB(:));

% Save the AB and sumAB variables to the Matlab save file out.mat:
save out.mat AB sumAB;
As always, we will need a qsub script too. We'll call it matrixmultiply.qsub and it will contain:
#!/bin/bash
: The above line tells Linux to use the shell /bin/bash to execute
: this script.  That must be the first line in the script.

: You must have no lines beginning with # before these
: PBS lines other than the /bin/bash line:
#PBS -N 'matrixmultiply'
#PBS -o 'qsub.out'
#PBS -e 'qsub.err'
#PBS -W umask=007
#PBS -q low_priority
#PBS -l nodes=1:ppn=1
#PBS -m bea

: Change our current working directory to the directory from which you ran qsub:
cd $PBS_O_WORKDIR

: Tell matlab to run our matrixmultiply.m file and then exit:
matlab -nodisplay -r "matrixmultiply, exit"

: The -nodesktop line tells matlab not to try to use any graphics or JVM.
: The -r specifies that the next argument "matrixmultiply, exit" is the
: list of commands to run.
Note that we're using nodes=1:ppn=1 for best throughput of Matlab jobs on hpc. See the technical report HPCF-2009-1 (Sharma & Gobbert) on the Technical Reports page for more details. As always, run your qsub script using qsub:
qsub matrixmultiply.qsub
After your job completes, you should see an out.mat Matlab save file in your directory. Later on, if you want to get the data out of that file, you can use the the load command in Matlab:
load out.mat
Which will load in the AB and sumAB variables that you saved using your save command.
Also in your directory, there should also be qsub.out and qsub.err files. The qsub.err file should be empty and the qsub.out file should contain this:
                            < M A T L A B (R) >
                  Copyright 1984-2008 The MathWorks, Inc.
                         Version 7.6.0.324 (R2008a)
                             February 10, 2008


  To get started, type one of these: helpwin, helpdesk, or demo.
  For product information, visit www.mathworks.com.
You should be able to use any of the usual non-graphical Matlab functionality if you follow the directions in this section. If you want to generate graphics in your Matlab jobs, read the next section:
Generating Plots on the Cluster Nodes
| Read the Previous Section The previous section explains the mechanics of running Matlab on HPC. This section builds on that and explains how to save plots (and get around one Matlab bug). If this section doesn't make sense to you, read the previous section for more information. |
| Matlab Bug is Fixed An earlier version of this page said that there was an error in how Matlab was installed (a dynamic library was missing) and that you had to use an ugly hack to get around that. We have corrected the error, and so you can now plot in Matlab the usual way. Read below for updated instructions on how to generate plots. |
As with all cluster jobs, you will need a qsub script in order to run Matlab:
#! /bin/bash
: The above line tells Linux to use the shell /bin/bash to execute
: this script.  That must be the first line in the script.

: You must have no lines beginning with # before these
: PBS lines other than the /bin/bash line:
#PBS -N 'hello_parallel'
#PBS -o 'qsub.out'
#PBS -e 'qsub.err'
#PBS -W umask=007
#PBS -q low_priority
#PBS -l nodes=1:ppn=1
#PBS -m bea

: Change our current working directory to the directory from which you ran qsub:
cd $PBS_O_WORKDIR

: Tell matlab to run our plotsine.m file and then exit:
matlab -nodisplay -r "plotsine, exit"
Now you'll need the plotsine.m file that the script tries to run:
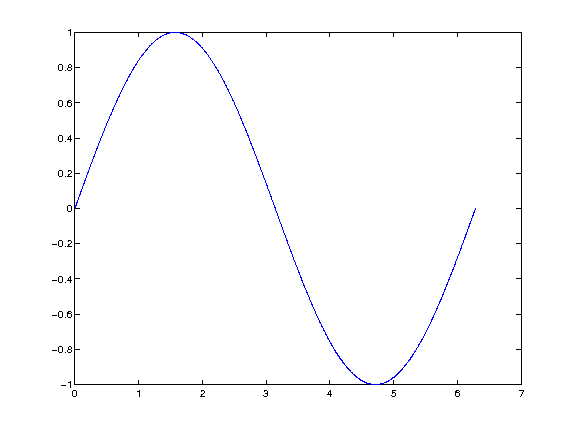
zero_to_2pi=linspace(0,2*pi,1000);
them_sine=sin(zero_to_2pi);

plot(zero_to_2pi,them_sine);
print -dpng sine.png
print -deps sine.eps
print -djpeg sine.jpeg
Now run qsub plotsine.qsub and wait for it to finish. After it finishes, type ls -l and you should see the following files:
username@hpc:~/run-sams-fine-examples/> ls -l
-rw-rw---- 1 username your_group   179 Oct 23 20:20 plotsine.m
-rw-rw---- 1 username your_group   922 Oct 23 21:06 plotsine.qsub
-rw-rw---- 1 username your_group     0 Oct 23 21:06 qsub.err
-rw-rw---- 1 username your_group   476 Oct 23 21:06 qsub.out
-rw-rw-r-- 1 username your_group 13413 Oct 23 21:06 sine.eps
-rw-rw-r-- 1 username your_group 15657 Oct 23 21:06 sine.jpeg
-rw-rw-r-- 1 username your_group  4316 Oct 23 21:06 sine.png
The exact file sizes may differ. That "libglu.so.1 ->" line is the symbolic link that we made to fool Matlab into thinking it was installed correctly. The sine.eps, sine.jpeg and sine.png files contain a plot of sin(x) from x=0..2*pi. The files are encapsulated postscript (.eps), joint photographic experts group (.jpeg) and portable network graphics files (.png), respectively. The qsub.err file should be empty and the qsub.out file should contain the same text as in the previous section. The three images you made should look something like this:

The encapsulated postscript file (sine.eps) will be in greyscale since I used -deps instead of -depsc. Here are links to the three output files if you want to download them: